Smart Money Options Indicator Now ‘Off The Charts’ Bearish

We have mentioned the put/call ratio of open interest on S&P 100 (OEX) options a handful of times over
the past 6 months or so. The reason is that this historically “smart money” indicator has been flashing warning signs off and on during that period. On March 3, we posted our most recent update on the indicator as it was on an unprecedented string of bearish readings. The stock market peaked simultaneously and has drifted sideways in the 6 or 7 weeks since. The bearish OEX put/call readings have not relented, however. In fact, the bearishness has accelerated. Even so, we had not intended to dedicate another post to this indicator so as not to be redundant. However, the readings over the last few days warrant an update as they have become so extreme, they stick out on the chart like a sore thumb – kind of like Wilt Chamberlain’s 4th grade class picture.
As a refresher, we typically scan for extreme readings in put/call ratios in the options market in order to fade them. For example, when a certain put/call ratio reaches what has historically been a high extreme, it is often a “buy signal” in that market as it indicates that traders have become too fearful or bearish due to their preference for puts relative to calls. One market that has historically been an exception to this “contrarian” rule is the OEX options market. For whatever reason, these traders have, more often than not, been correctly positioned at market extremes (i.e., high put/call readings near market tops). And while volume in the market has dropped significantly in the past few decades, its non-contrarian status has not seemed to change.
Since 1998, the put/call ratio on open interest in OEX options has been considered extremely elevated when it has risen above 2.00. From 1998 to 2011, there were just 6 days when the ratio got as high as 2.00. Each of those days either came in the vicinity of a significant market top or at least presented extremely limited upside in the intermediate-term. In the second half of 2014 alone, there were 8 readings. And 2015 has ratcheted up the frequency of such readings to a whole other level. There have now been no less than 34 readings above 2.00, all coming in the past 2 months.
And it hasn’t just been the frequency of the readings, but the magnitude as well. Before a week ago, the highest level of the OEX open interest put/call ratio since 1998 was 2.31 in November 1999. The past 2 days have seen readings of 2.77 and 2.79!
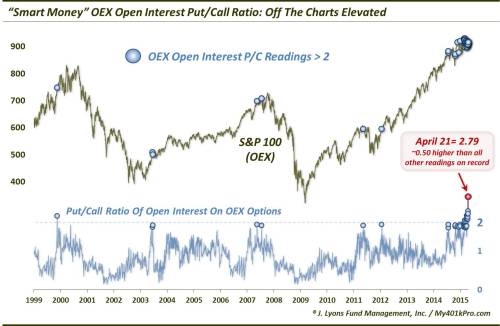
It isn’t difficult to spot the “Wilt the Stilt” readings on the far right of the chart, nearly 0.50, or 20%, higher than any other reading on record. And based on historical readings above 2.00, this would appear to be a warning sign. Consider the performance of the S&P 100 following other readings above 2.00 from 1999 to 2014 (it is obviously too early to judge 2015′s readings and, additionally, the 2014 readings do not have a 1-year forward return or, for some, a 6-month return.)
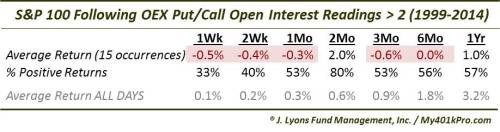
Obviously, considering these returns came during a 16-year period of historically below-average returns, it’s not surprising to see them somewhat depressed. However, the negative average return out to even 6 months (-0.02% to be exact) is noteworthy. Furthermore, considering the substantial drawdowns suffered in the aftermath of several of these readings, the above returns may actually understate the risk following put/call readings above 2.00. Consider the dates of the occurrences prior to 2014, including November 1999, June 2003, May-July 2007, May 2011 and January 2012. Of those, only the 2012 occurrence did not result in either sideways action for 3 months (2003) or a major selloff (each of the others).
Of course, we cannot dismiss the occurrences since the beginning of 2014. Obviously, they have not (yet) resulted in anything close to the aftermath of most of the prior occurrences. However, even they have shown to be somewhat effective in forecasting at least short-term weakness. Of the 24 put/call readings over 2.00 since the start of 2014, only 5 really showed gains 1 month later.
The obvious question, pertinent to many of our posts over the past 12 months or so, is whether the recent market regime is here to stay or whether it is the outlier. As we stated in a previous post, we would argue that is is too soon to pass judgement on the indicator’s contemporary relevance on the intermediate to longer-term time frame. At a minimum, based only on the results over the past 8 months, we can accept that elevated readings of the OEX open interest put/call ratio suggest merely short-term negative connotations for the market.
However, given its more extensive history as a warning sign as well as the current “off the charts” magnitude of the indicator’s readings, we can’t help but wonder if there will eventually be longer-term ramifications as well.
No comments:
Post a Comment